Options Foundations
Profit and Loss Charts
Profit and loss charts—commonly referred to as P/L charts—are a visual tool for options traders. P/L charts help analyze potential outcomes by plotting projected profits and losses against stock prices for a specific option strategy.
Key components of P/L charts
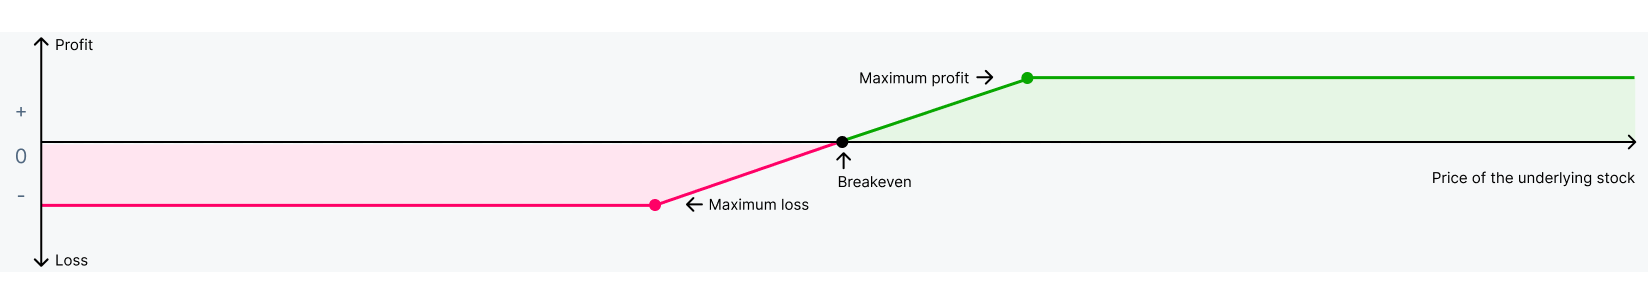
- Vertical axis (Y-axis)Represents theoretical profits (above zero) and losses (below zero)
- Horizontal axis (X-axis)Represents the price of the underlying stock
- BreakevenThe stock price at which you neither make a profit nor incur a loss. The premium paid/collected is included in the breakeven
- Maximum lossThe stock price at which your potential losses are at their highest, and any stock price movement past this point will not increase your losses any further. For options strategies where potential losses are unlimited, no maximum loss point exists
- Maximum gainThe stock price at which your potential gains are at their highest, and any stock price movement past this point will not increase your gains any further. For options strategies where potential gains are unlimited, no maximum gain point exists
It’s important to note that there may be additional fees charged by your Brokerage that impact your net gains/losses.
Basic call example
Assume you buy a call option with a $55 strike price, expiring in six months, for a premium of $2.50.
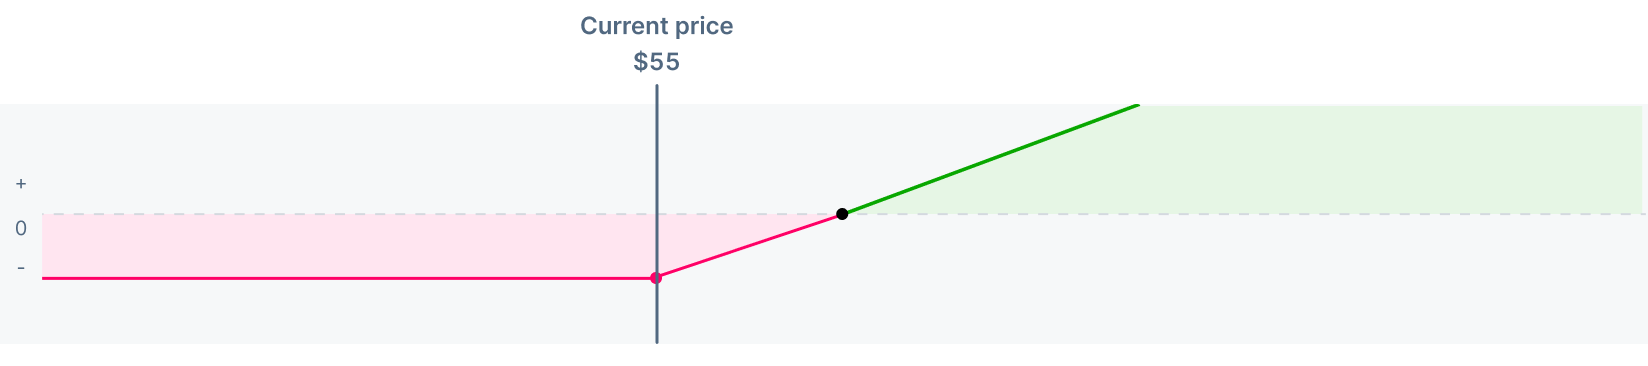
- Max loss: $250At any stock price below $55, your maximum loss is the premium you paid, or $250
- Breakeven: $57.50The breakeven is equal to the strike price plus the premium, or $57.50. At this point, your P/L is $0
- Profit: UnlimitedAny stock price above $57.50 represents potential profit. Since the stock can continue increasing, your profit potential is unlimited
To note, if the call is at least a penny in-the-money at expiration, your contract will automatically exercise, posing a potential risk if you don’t have the necessary buying power.
Basic put example
Now, assume you buy a put option with a $45 strike price, expiring in six months, for a premium of $2.50.
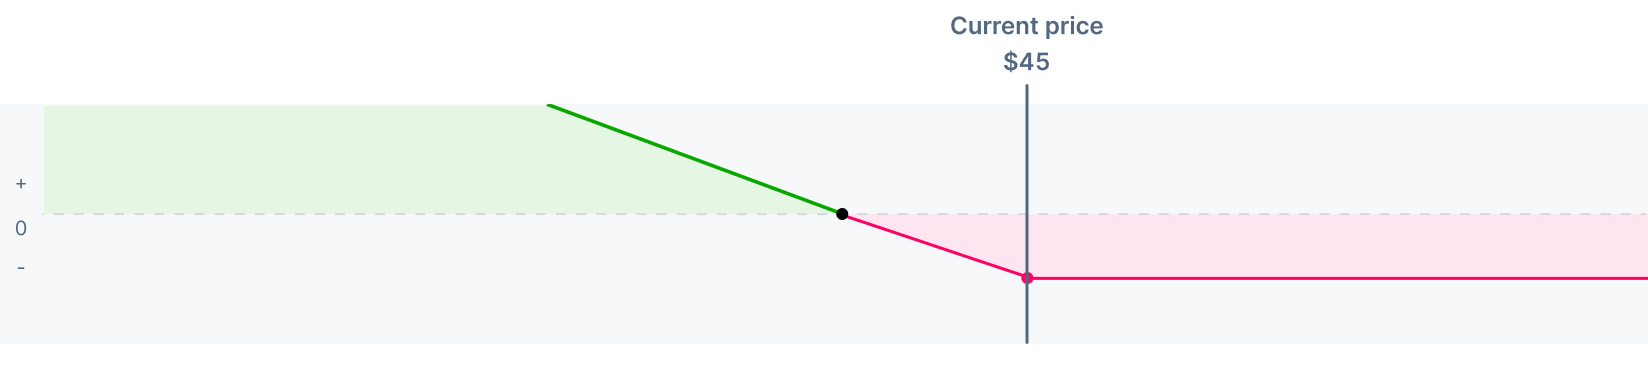
- Max loss: $250At any stock price above $45, your maximum loss is the premium you paid, or $250
- Breakeven: $42.50The breakeven is equal to the strike price minus the premium, or $42.50. At this point, your P/L is $0
- Profit: Almost UnlimitedAny stock price below $42.50 represents potential profit. Since the stock price has a lot of room to decline, your profit potential is very high
If your put is at least a penny in-the-money at expiration, your contract will automatically exercise, posing a potential risk if you don’t have the necessary shares.
Brokerage services for US-listed securities and options offered through Public Investing, member FINRA & SIPC. Supporting documentation upon request.
The examples used above are fictional, and do not constitute a recommendation or endorsement of any investment.
Options are not suitable for all investors and carry significant risk. Certain complex options strategies carry additional risk. There are additional costs associated with option strategies that call for multiple purchases and sales of options, such as spreads, straddles, among others, as compared with a single option trade.
Prior to buying or selling an option, investors must read the Characteristics and Risks of Standardized Options, also known as the options disclosure document (ODD).
Option strategies that call for multiple purchases and/or sales of options contracts, such as spreads, collars, and straddles, may incur significant transaction costs.
Options resource center
Options Foundations
 Chapter 1Options 101
 Chapter 2P/L charts
 Chapter 3Time value
 Chapter 4The greeks
 Chapter 5Exercise and expirationChapter 6Assignment
 Chapter 7Loss potentialChapter 8Options trading rebate
Fundamentals
Multi-leg Strategies
Complex